

Market: United Kingdom | Category: Pet supplements | Period: June to October 2024
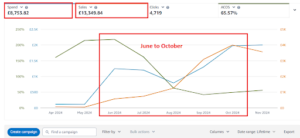
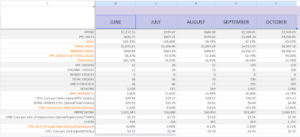
When we took the account over in June 2024, the brand was losing money on every ad it ran. Ad spend was £1,137.15. PPC sales were £626.77. Total sales across the whole account were £1,075.61.
True ACoS was 105.72%. The account was spending £1.06 in ads for every £1.00 of revenue, measured across the entire business, not just the ad-attributed portion.
The deeper problem was conversion. The listing took 1,038 sessions that month and converted 3.66% of them. Clicks were 418 against 1,031,043 impressions. CPC was £2.72, and it cost £29.93 in ad spend to produce a single order.
Organic ranking was poor, category relevance was weak, and the listing had no standing against the established UK pet supplement brands.
We ran the account through three deliberate phases: Spending, Stability, Scalability. Each phase has a different job, and the ACoS you should expect from each is different. Judging phase one by phase three’s numbers is how most turnarounds get pulled before they work.
The job in month one was relevance, not profit.
June closed at 181.43% ACoS and 105.72% True ACoS. That was the plan. One month of deliberate loss bought the keyword data and category relevance, and we knew exactly what month two had to do with it.
The job now was to take the cost out without losing momentum.
July 2024: £939.97 spend, £1,268.40 total sales, 154.80% ACoS, 74.11% True ACoS, 8.64% conversion rate.
August 2024: £686.98 spend, £1,859.29 total sales, 70.78% ACoS, 36.95% True ACoS, 9.61% conversion rate.
August is the month the account turned. Spend came down 40% from June while total sales went up 73%. CPC fell from £2.72 to £1.78. Cost per order fell from £29.93 to £9.81. True ACoS improved 69 points in two months, from 105.72% to 36.95%.
With a profitable base, the job became volume without breaking the economics.
September 2024: £1,300.01 spend, £4,917.05 total sales, 42.14% ACoS, 26.44% True ACoS.
October 2024: £1,978.05 spend, £8,997.16 total sales, 49.07% ACoS, 21.99% True ACoS.
October is worth reading carefully. ACoS went up, from 42.14% to 49.07%, while True ACoS went down, from 26.44% to 21.99%. That is the signature of a healthy scale. We paid slightly more per ad-attributed sale, and the business as a whole became more profitable because organic was carrying more of the load.
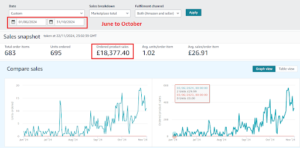
The organic order count tells that story plainly. In June the listing took 15 organic orders. In October it took 168.
| Month | Phase | Ad spend | PPC sales | Organic sales | Total sales | ACoS | True ACoS | CVR |
| June 2024 | Spending | £1,137.15 | £626.77 | £448.84 | £1,075.61 | 181.43% | 105.72% | 5.50% |
| July 2024 | Stability | £939.97 | £607.21 | £661.19 | £1,268.40 | 154.80% | 74.11% | 8.64% |
| August 2024 | Stability | £686.98 | £970.62 | £888.67 | £1,859.29 | 70.78% | 36.95% | 9.61% |
| September 2024 | Scalability | £1,300.01 | £3,084.78 | £1,832.27 | £4,917.05 | 42.14% | 26.44% | 14.53% |
| October 2024 | Scalability | £1,978.05 | £4,030.85 | £4,966.31 | £8,997.16 | 49.07% | 21.99% | 12.07% |
Across five months:
Here is the number that explains the whole case. Sessions only doubled, from 1,038 to 2,090. Sales went up 8.4 times.
Growth did not come from buying more traffic. It came from converting the traffic the listing already had. Unit session percentage went from 3.66% to 14.74%, which is four times as many visitors turning into buyers. That is what the listing rewrite, the review building and the tighter targeting were actually for.
The second thing is that organic outran PPC. Organic sales grew 1,006% against PPC sales at 543%. By October, £4,966 of the £8,997 was arriving with no ad spend behind it. That is what the Spending phase was buying. A month at 181% ACoS looks like waste on a report. What it bought was the keyword data, the category relevance and the early velocity that made months three, four and five possible. Cut that phase short and the account stays where it started.
The third thing is that we never optimised for ACoS on its own. ACoS rose in October and we let it, because True ACoS, the number tied to the profit of the whole business, kept falling. An account managed to ACoS alone would have pulled spend back at exactly the wrong moment.