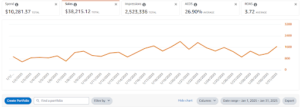
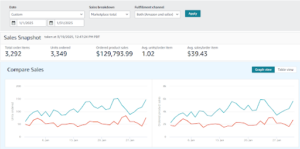
A well established health supplement brand in the United States was already selling on Amazon at scale. In the 31 days from 1 January to 31 January 2025 the account produced $129,793.99 in total sales from 3,292 orders.
The advertising underneath that number was not doing much work. Ad spend of $10,281.37 returned $38,215.12 in PPC sales at a 26.90% ACoS. On paper that looks healthy. In practice the account was running on autopilot, and two gaps were costing the brand money every single day.
Branded keywords were completely absent from the account. Shoppers searching the brand by name were landing on competitor sponsored placements. The brand was paying to acquire a customer, building the demand, and then handing the final click to someone else.
Several keywords sat just outside the top 30 organic positions. These are the terms closest to breaking through, and they were receiving no paid support. Without paid velocity behind them they were never going to move.
The account was accumulating 2,523,336 impressions a month and converting them into only $15.14 of PPC sales per thousand impressions. The reach was there. The intent behind it was not.
We mapped every keyword the brand ranked inside the top 30 for and flagged the ones with real search volume. Those became the paid priority. Separately we built out the branded keyword set the account had been ignoring.
Branded terms were launched across exact, phrase and broad match so the brand could own its own search results. Emerging keywords with no prior ranking history were given their own campaigns rather than being buried inside existing ad groups where their data would be invisible.
Campaigns were split by buying stage rather than lumped together. Discovery terms, consideration terms and high intent purchase terms were each given their own budget and their own bidding logic, so a top of funnel click was no longer competing with a ready to buy click for the same dollar.
Backend search terms and listing copy were rewritten around high volume relevant keywords. This matters more than it sounds. Paid traffic that lands on a listing Amazon does not consider relevant converts worse and costs more.
Compared period: 1 January to 31 January 2025 against 1 February to 3 March 2025. Both periods are 31 days.
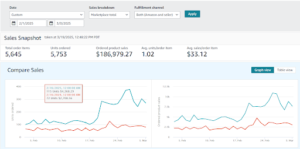
| Metric | Before (1 Jan to 31 Jan 2025) | After (1 Feb to 3 Mar 2025) | Change |
| Total sales | $129,793.99 | $186,979.27 | +$57,185.28 (+44.1%) |
| Orders | 3,292 | 5,645 | +2,353 (+71.5%) |
| Units ordered | 3,349 | 5,753 | +2,404 (+71.8%) |
| PPC sales | $38,215.12 | $73,122.79 | +$34,907.67 (+91.4%) |
| Ad spend | $10,281.37 | $21,087.97 | +$10,806.60 (+105.1%) |
| Impressions | 2,523,336 | 2,445,423 | -77,913 (-3.1%) |
| ACoS | 26.90% | 28.84% | +1.94 pts |
| ROAS | 3.72 | 3.47 | -0.25 |
| TACoS | 7.92% | 11.28% | +3.36 pts |
| Organic sales | $91,578.87 | $113,856.48 | +$22,277.61 (+24.3%) |
| PPC share of total sales | 29.4% | 39.1% | +9.7 pts |
This is the single most important line in the table. Impressions dropped 3.1%, from 2,523,336 to 2,445,423. PPC sales rose 91.4%. Sales per thousand impressions went from $15.14 to $29.90, a 97.4% improvement.
The account did not grow by buying more eyeballs. It grew by buying better ones. Every dollar moved out of broad low intent reach and into branded searches and near-ranking keywords where the shopper was already close to a decision.
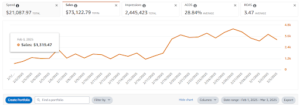
ACoS went from 26.90% to 28.84%. ROAS slipped from 3.72 to 3.47. We are not going to present that as a win, because it is not one in isolation.
Here is the trade. Holding ACoS at 26.90% would have meant capping spend, and capping spend at that point would have meant leaving the branded keyword gap open and leaving the near-ranking keywords unsupported. The brand chose to spend an extra $10,806.60 and received an extra $57,185.28 in total sales. That is $5.29 of additional revenue for every additional advertising dollar.
For a brand in a scaling phase, 1.94 points of ACoS is a reasonable price for 44% top line growth. For a brand optimising for margin rather than share, it would not be.
Organic sales rose from $91,578.87 to $113,856.48, an increase of $22,277.61. The organic share of total sales fell from 70.6% to 60.9%, which happens whenever paid grows faster than organic, but the underlying organic business got bigger, not smaller. The paid support behind near-ranking keywords was feeding the organic side rather than cannibalising it.
Average sales per order item dropped from $39.43 to $33.12, a 16% decline, while units per order stayed flat at 1.02. More customers bought, but they bought cheaper items. The sales mix shifted toward lower priced variations. That is normal when a campaign widens its reach, and it is the first thing to review in the following month.
If you are running Amazon ads without branded campaigns, you are paying to create demand that a competitor converts. That gap is usually the fastest fix in an account.
If you have keywords sitting just outside the top 30, they are the cheapest ranking gains available to you. They need paid velocity to move, and most accounts never give it to them.
And if your impressions are high but your sales per impression are low, the problem is not budget. It is where the budget is pointed.