

Market: United States | Category: Herbal supplements | Catalogue: 6 products | Period: August to October 2024
The client sells six supplement products. The goal was to scale visibility and sales across the catalogue heading from Q3 into Q4, when demand in the category rises.
Rather than lift the budget once and hope, we raised it in controlled steps and measured what each increase bought. If efficiency held as spend went up, we would keep going. If it degraded past a point we were willing to pay, we would stop.
Spend was raised in stages, not in a single jump. Each increase was given time to produce data before the next one. That gave a clear read on whether the account was absorbing more budget or simply paying more for sales it would have made anyway.
The test was narrow: what happens to ACoS as spend rises? A small deterioration is the normal price of reaching new buyers. A large one means the ceiling has been found.
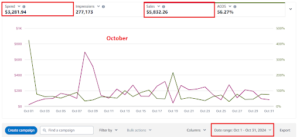
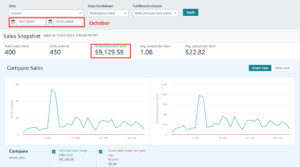
October was the month we pushed hardest, deliberately, because that is when category demand climbs. The October budget was the most aggressive of the three and was timed to capture the seasonal lift rather than to run at that level permanently.
Budget moved toward the keywords and placements that were converting and away from the ones that were not. The increases were not spread evenly across campaigns. They went where the performance data said they would be absorbed.
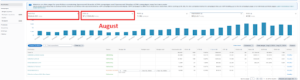
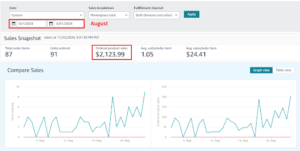
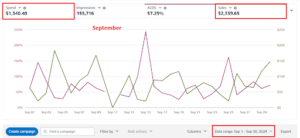
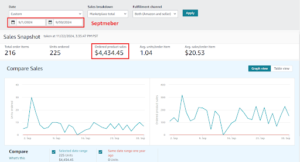
Spend rose 138.1%. PPC sales rose 111.8%. Total sales rose 108.8%.
Spend rose 144.8%. PPC sales rose 149.3%. Total sales rose 105.9%.
The two increases were almost the same size. What they bought was different, and that is the finding.
The first increase, August into September, raised spend 138.1%. PPC sales rose 111.8%, slower than the spend. ACoS went from 50.98% to 57.29%, six and a half points worse. That is the normal cost of moving beyond the cheapest, most obvious demand into traffic that converts less readily.
The second increase, September into October, raised spend 144.8%, almost identical in size. This time PPC sales rose 149.3%, slightly faster than the spend, and ACoS improved from 57.29% to 56.27%.
The second increase was absorbed better than the first despite being larger. Two things explain it. The campaigns had a month of data behind them, so the extra budget went to keywords and placements that had already proven themselves rather than into discovery. And October is when category demand peaks, so there were simply more buyers to reach at the same bid.
That is the practical takeaway. The expensive part of scaling is the first step past your comfortable spend level. Once the account has learned where the demand is, the next step of the same size costs less.
TACoS rose across the period, from 26.51% in August to 35.95% in October. That is the honest read and it is the cost of this strategy.
Organic sales grew in absolute terms, from $1,019.56 to $3,297.32, up 223%. But PPC sales grew faster, up 428%, so organic went from 48.0% of total revenue down to 36.1%.
In plain terms, the account grew while becoming more dependent on advertising. That is the expected trade in an aggressive seasonal push, and it is why this was framed as a Q4 phase rather than a permanent posture. The next phase moderates the budget, protects the rankings the spend built, and lets organic take back share.
Average order value stayed in a narrow band across all three months, $24.41, $20.53 and $22.82, so the growth came from more customers rather than from a pricing or bundling change.
Three things follow a push like this.
Budget moderation for the rest of Q4, holding momentum while bringing efficiency back. Keyword focus on the terms that proved themselves during the scale rather than maintaining breadth for its own sake. Listing and relevance work to grow organic traffic, which is what brings TACoS down over time without giving up the sales.
Only at a pace the account can absorb. Here the first increase of 138% cost six points of ACoS, and the second increase of 145% cost nothing and actually improved it. The difference was data. The second increase went to keywords that had already proven themselves. Raise the budget in steps, watch ACoS after each one, and expect the first step to be the expensive one.
TACoS measures ad spend against total sales. When PPC sales grow faster than organic sales, TACoS rises even though the business is growing. Here organic revenue grew 223% in absolute terms but PPC grew 428%, so organic share fell from 48.0% to 36.1% and TACoS went from 26.51% to 35.95%. It is an acceptable trade during a seasonal push and it is meant to reverse afterwards.
This account went from $563.02 to $3,281.94 in monthly ad spend across three months, an increase of 483%, while monthly sales grew 330%. ACoS moved from 50.98% to 56.27% across the whole period, about five points. The pace was set by the data rather than a schedule: each increase was given time to produce results before the next, so the ceiling would appear as rising ACoS before money was wasted at the higher level.
| Month | PPC spend | PPC sales | ACoS | Impressions | Total sales | Orders | Units | Organic sales | TACoS |
| August 2024 | $563.02 | $1,104.43 | 50.98% | 80,537 | $2,123.99 | 87 | 91 | $1,019.56 | 26.51% |
| September 2024 | $1,340.40 | $2,339.65 | 57.29% | 155,716 | $4,434.45 | 216 | 225 | $2,094.80 | 30.23% |
| October 2024 | $3,281.94 | $5,832.26 | 56.27% | 277,173 | $9,129.58 | 400 | 430 | $3,297.32 | 35.95% |