How a restricted supplement went from zero sales to $7,813 a month on PPC alone

Niche

Supplements

Service

PPC Management

Timeframe

3 months

Stage

New launch
amazon-supplement-ppc-launch-scaling-case-study
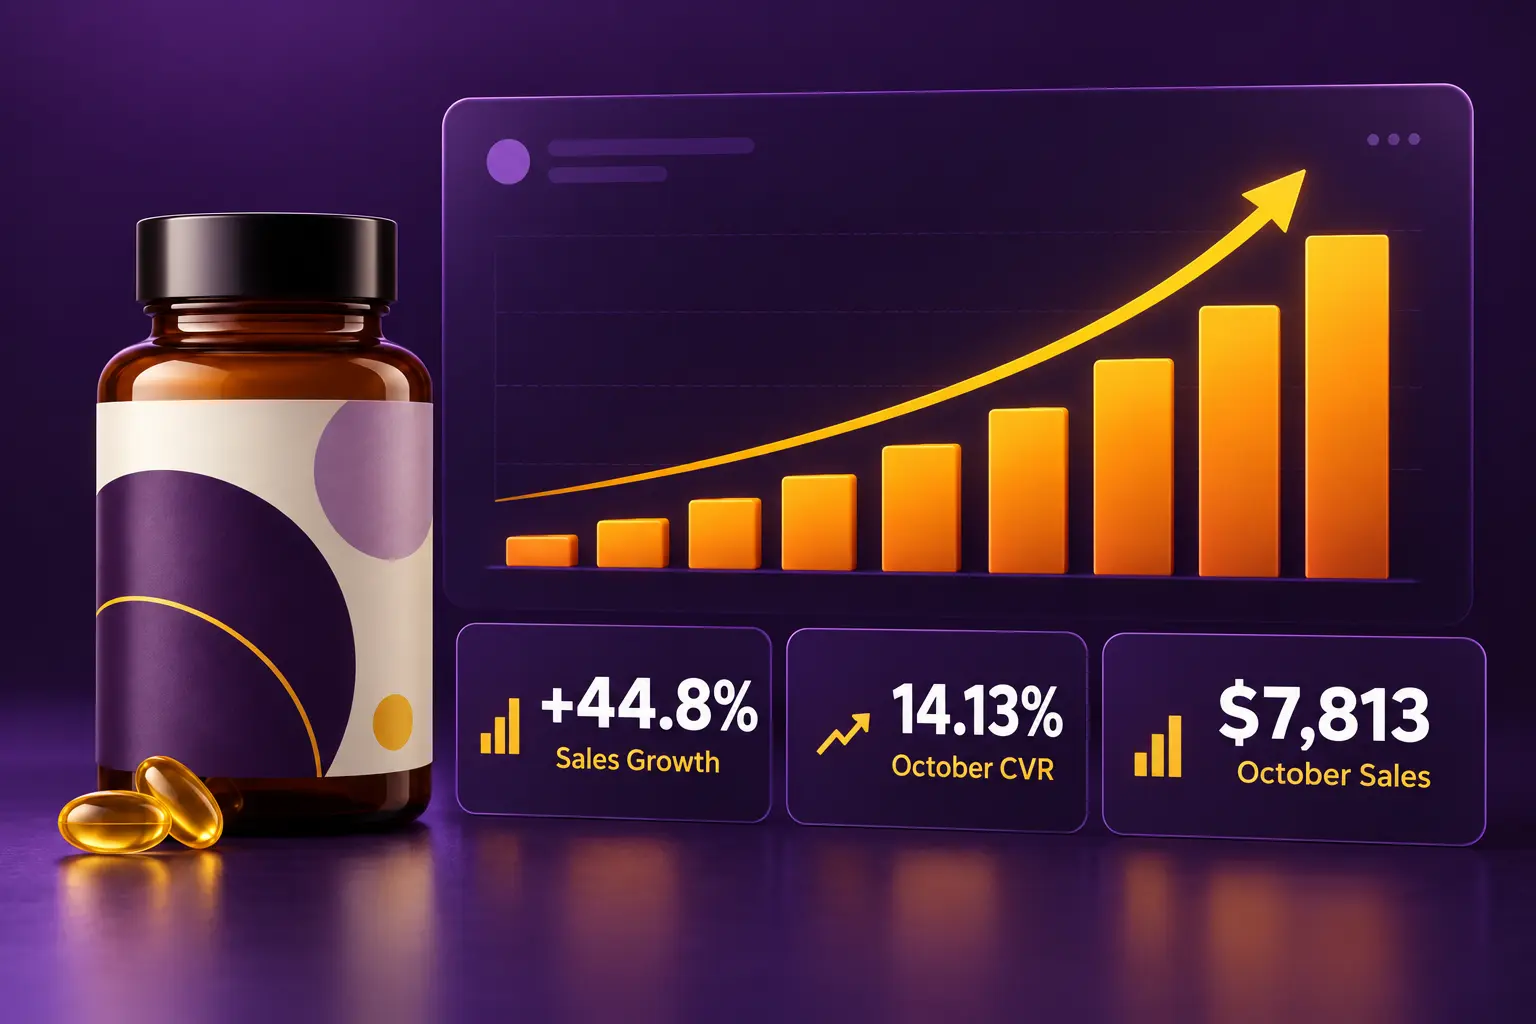
+45%
Total sales
+53%
PPC sales
25.1%
True ACoS
3
Months

The starting point

The product hit Amazon in June 2025 with nothing behind it. No organic indexing, no keyword relevancy, no ranking positions, no sales history, almost no visibility.

It also sat in a medically sensitive category, which ruled out most of the usual launch toolkit. No SEO push, no keyword stuffing, no external indexing, no ranking tricks. One channel was left that was both safe and scalable: PPC.

What we did

We ran an aggressive PPC-first launch from day one, built to force the listing in front of buyers before it had any organic standing.

  •  Launched all core campaign types at once, Exact, Phrase and Broad
  •  Isolated the only 6 to 7 keywords that were both relevant and compliant
  •  Targeted competitor ASINs to pull early traffic from established listings
  •  Pushed bids hard at the start to buy top-of-search impressions
  •  Allocated budget for breakthrough, not for efficiency, in the first weeks
  •  Tested warm traffic to read actual buyer behaviour instead of guessing

By the end of August the listing had its first real month of revenue. From there the work shifted from forcing entry to tightening efficiency: cutting waste, strengthening ad-to-keyword relevancy, and converting paid momentum into organic position.

The results

Across three months, total sales grew 45%, organic sales grew 40%, and True ACoS improved every single month. That last one matters most. It is the sign the business got more profitable, not just busier.

Month Ad spend PPC sales Organic sales Total sales ACoS True ACoS
August $1,529.00 $2,257.00 $3,119.50 $5,376.50 67.7% 28.44%
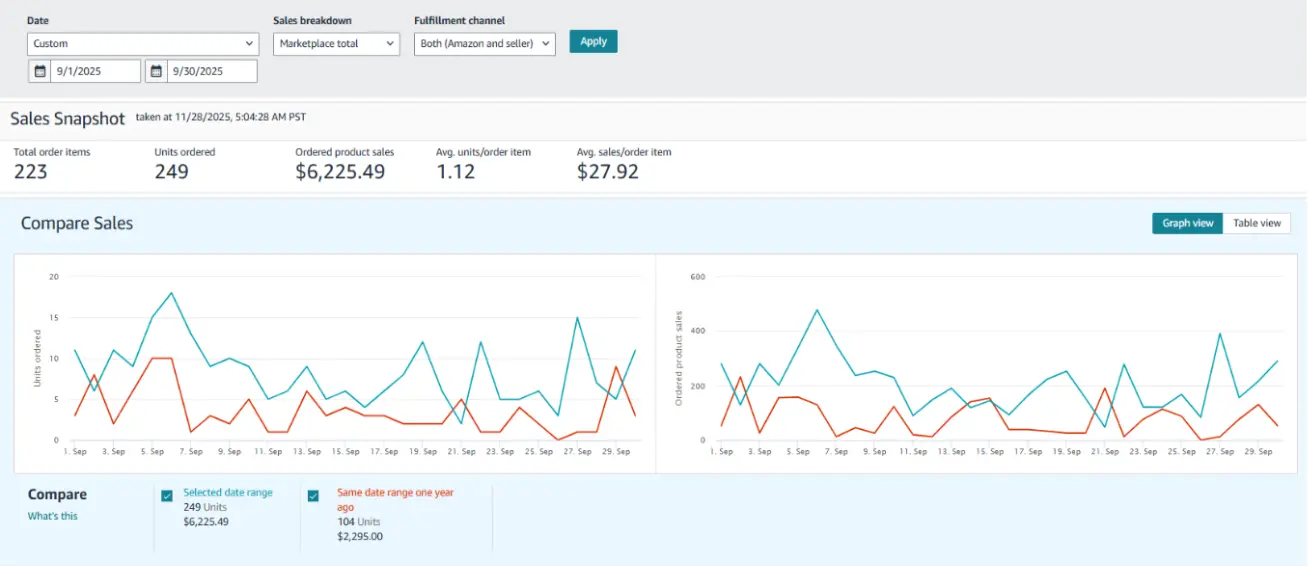
September $1,701.19 $3,457.94 $2,767.55 $6,225.49 49.2% 27.33%
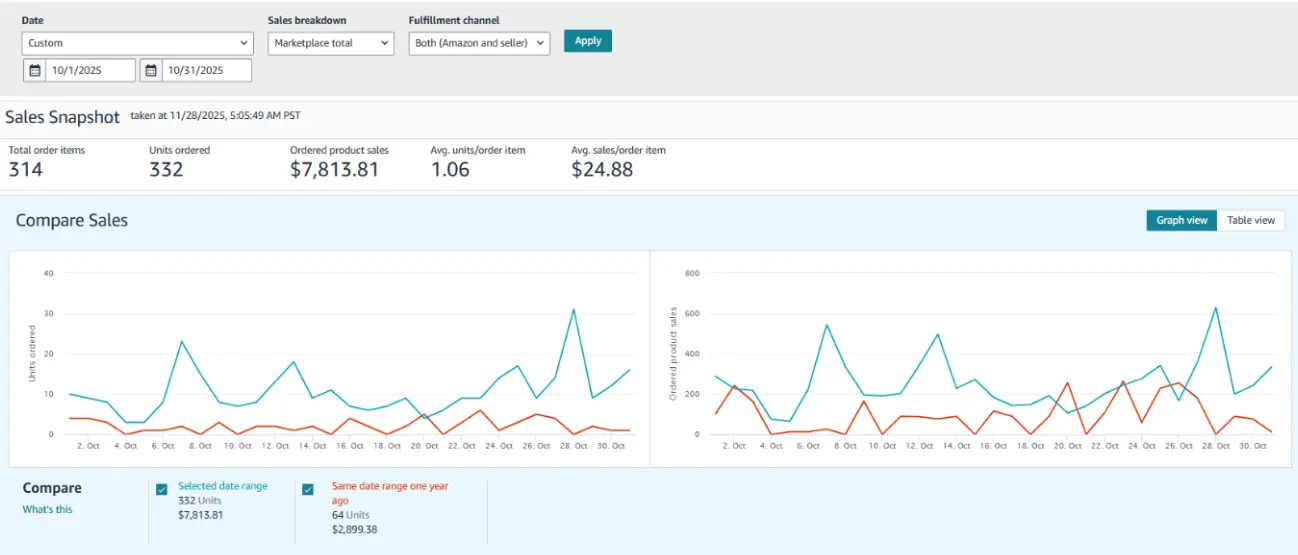
October $1,959.41 $3,447.11 $4,366.70 $7,813.81 56.8% 25.08%

August was the breakthrough month. The aggressive push bought visibility at a 67.7% ACoS, which is what breaking into a competitive niche costs. 212 order items, $5,376.50 in sales.
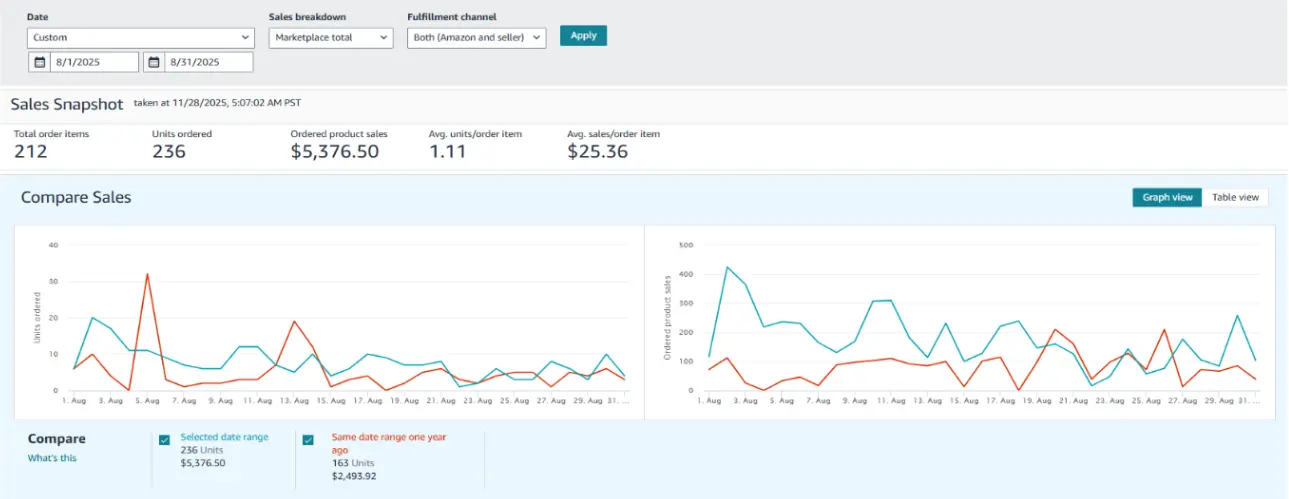
Amazon Seller Central sales snapshot for August 1–31, 2025, showing 212 order items, 236 units ordered, and $5,376.50 in ordered product sales. The same date range a year earlier shows 163 units and $2,493.92 in sales.

September was the first month of stability. We identified the converting keywords, removed waste and tightened campaigns. ACoS dropped 18.5 points to 49.2% on $1,701 of spend, and the listing did $6,225.49.
September 2025 Amazon PPC dashboard showing $1,701.19 spend, $3,457.94 sales, 138,291 impressions, 117 orders and 919 clicks.

Amazon Seller Central sales snapshot for September 1–30, 2025, showing 223 order items, 249 units ordered, and $6,225.49 in ordered product sales. The same date range a year earlier shows 104 units and $2,295.00 in sales.

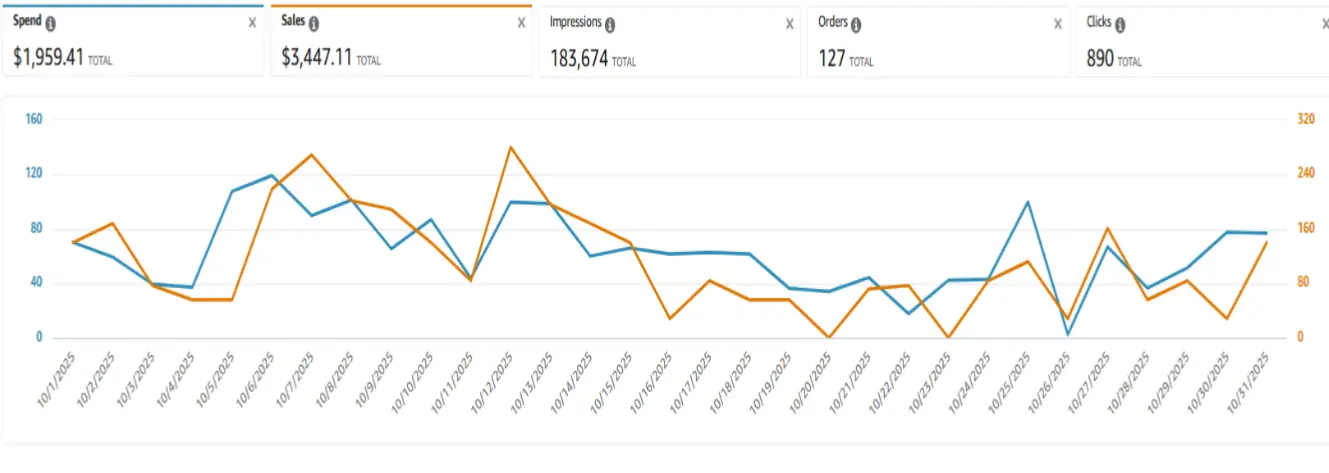
October was the scaling month. Organic sales climbed to $4,366 from $2,767, the highest of the three months, because PPC conversions had fed ranking signals back into the listing. True ACoS hit its best level at 25.08%, order items jumped from 223 to 314, and total sales reached $7,813.81.
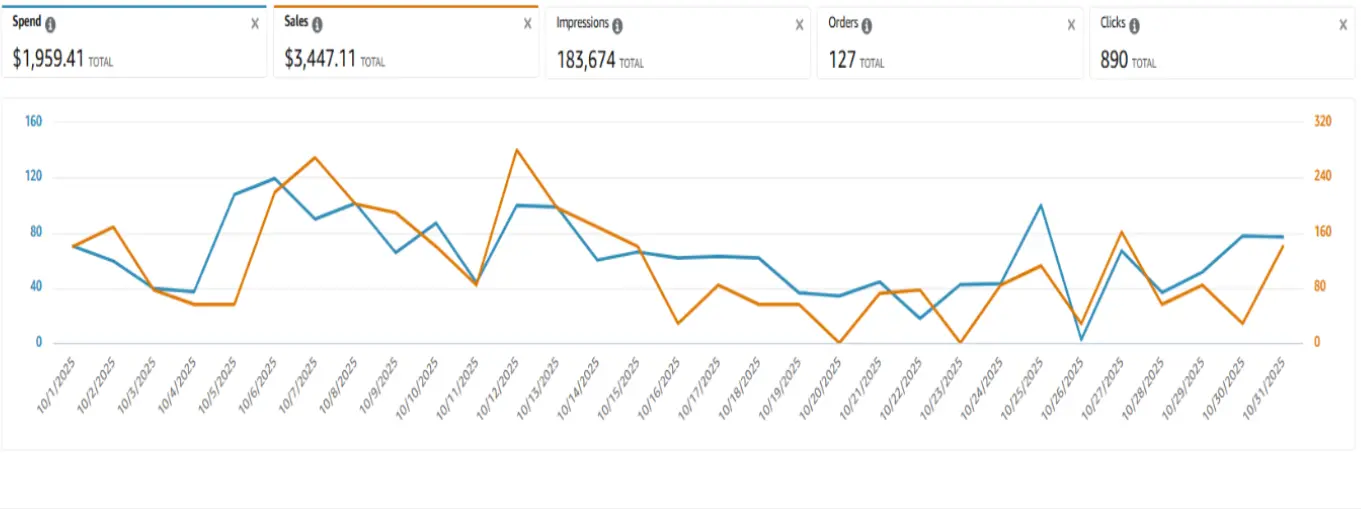
Amazon Advertising dashboard for October 1–31, 2025, showing $1,959.41 spend, $3,447.11 sales, 183,674 impressions, 127 orders, and 890 clicks, with daily performance trends.

Amazon Seller Central sales snapshot for October 1–31, 2025, showing 314 order items, 332 units ordered, and $7,813.81 in ordered product sales. The same date range a year earlier shows 64 units and $2,899.38 in sales.

Why it worked

In a category where you cannot optimise your way to rankings, paid conversions are the ranking signal. Every PPC sale fed relevancy back into the listing, which lifted organic position, which produced sales that cost nothing in ad spend.

That is why True ACoS fell every month while spend went up. In August, every dollar of revenue cost 28.4 cents in ads. By October it cost 25.1 cents, on 45% more revenue.

Worth noting what did not happen. ACoS did not fall in a straight line. It dropped to 49.2% in September, then rose to 56.8% in October as we pushed spend back into a listing that was converting better. That is a deliberate trade: we bought more volume at a slightly worse ad efficiency because the blended number, the one tied to profit, kept improving.

Want results like this?

Get a free audit and see where your ACoS is leaking, no obligation.

More results

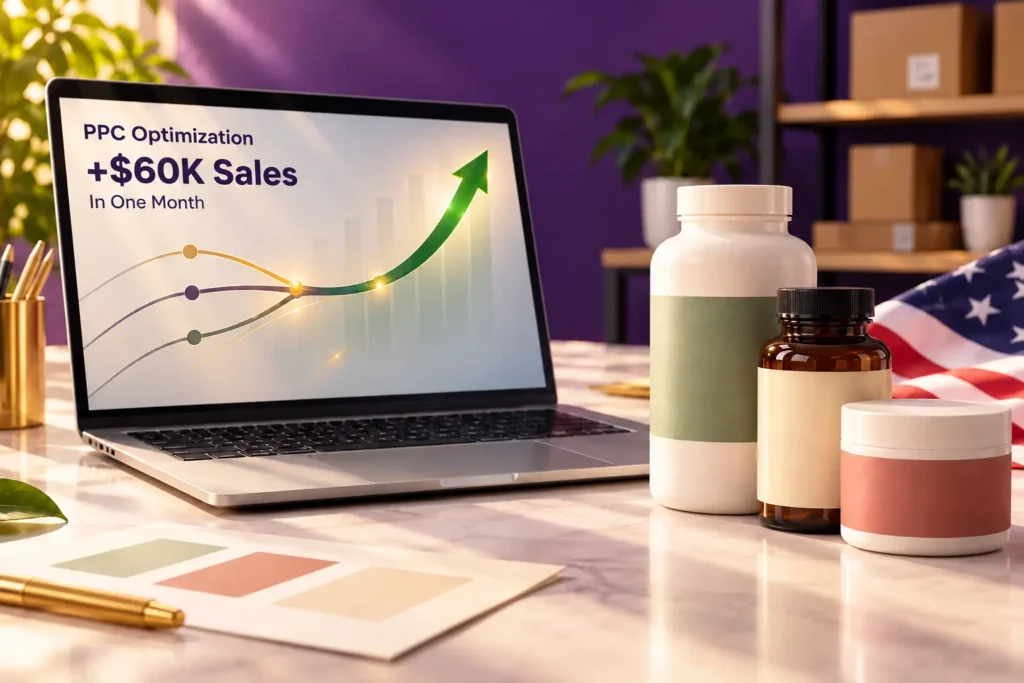
Health supplement bottles beside a US flag and laptop showing PPC optimisation delivering $60K in additional sales in one month.

Doubling Ad Spend Without Losing Control of ACoS

Total sales
+44%
PPC sales
+91%
True ACoS
11.3%
Branded keywords were missing entirely. We rebuilt the account around them and added $57,185 in sales in 31 days.
Read case study  →
Premium supplement product bottles arranged with botanical ingredients and packaging boxes on a purple studio background.

330% sales growth in 3 months

Monthly sales
+330%
Orders
+360%
Units sold
+373%
A six-product catalogue scaled into Q4 demand. Ad spend rose 483% and monthly sales went from $2,123 to $9,129.
Read case study  →
Amber bottle and white jar in an open shipping box, with increasing parcel stacks representing three months of Amazon sales growth.

Zero to $37,733 in 3 months

Total sales
$37.7K
Organic share
72%
True ACoS
17.6%
A new listing with no reviews, no rankings and no data. Twelve weeks later, 72% of revenue was arriving organically.
Read case study  →

Free PPC Audit

Your brand could be next.

Get a free audit and see exactly where your supplement brand can lower ACoS and grow. No fluff, no obligation.

Written audit · 3 business days · Complimentary · No sales pitch.