
Key Takeaways
Why TACoS is not a number you can pull from the Amazon ad console, and what a healthy figure looks like at each stage of a product’s life.
- Amazon does not define TACoS in its metric documentation. It is absent from the ACoS guide, the ROAS guide and the advertising FAQ, and there is no column for it in the ad console.
- Amazon does use the term, in one guide, in its own voice, stating that ACoS “only measures the efficiency of ad-attributed sales, not the full picture.”
- The only TACoS benchmark Amazon has published is a sub 10% goal in a case study for an established grocery brand, where the result came in at 5.51%.
- A single universal benchmark is the mistake every article makes. A launching product and a mature one should not share a target, and nobody has primary-source backing for stage figures.
- The denominator is where TACoS silently breaks, because total revenue can include wholesale, off-Amazon or uneven parent and child rollups.
Every article about TACoS gives you the formula and one benchmark band, usually 10 to 15%. That band is repeated so often it has the feel of an industry standard. No source has ever published it, and it cannot be right for both a product in its launch month and one in its fourth year.
Two things make this metric harder than it looks, and neither gets covered. The first is that Amazon does not report TACoS. There is no column for it, which means every TACoS figure you have ever seen was calculated by someone from two separate reports, with assumptions you did not see. The second is that the denominator, total revenue, is far less stable than it sounds.
This is written for a seller who already tracks ACoS, suspects it is hiding something, and wants a number that reflects the business rather than the ad account.
Quick Verdict: what TACoS is and is not
It is ad spend divided by total revenue, paid and organic together. ACoS divides the same ad spend by ad-attributed revenue only, which is why ACoS always looks better.
It is not an Amazon console metric. Amazon’s ACoS guide, ROAS guide and advertising FAQ never mention it. You build it from your ad spend and your total sales.
A rising TACoS at flat sales means ads are carrying the product. A falling TACoS at rising sales means organic is taking over, which is the outcome the whole exercise is for.
What does Amazon actually say about TACoS?
Less than you would expect, and the gap itself is the most useful finding.
Amazon’s guide to advertising cost of sales defines ACoS as “(ad spend ÷ ad revenue) x 100” and states that “there isn’t a definitive number for a good Amazon ACOS,” adding that “in order to maintain a profit, your Amazon ACOS needs to be lower than your profit margin.” The page never mentions TACoS. Neither does Amazon’s return on ad spend guide. Neither does the advertising FAQ, which defines ACoS and ROAS and stops there.
So TACoS is not a metric Amazon reports, benchmarks or gives you a column for.
Amazon does use the term once, and it is worth quoting because it is Amazon’s own copy rather than a guest contributor. In a guide on holiday advertising myths, Amazon writes: “But ACOS only measures the efficiency of ad-attributed sales, not the full picture. That’s where total advertising cost of sales (TACOS) comes in.” It continues: “TACOS reveals whether your total sales (organic and paid) are growing in relation to your ad spend.”
That is Amazon acknowledging the blind spot in its own headline metric and naming TACoS as the fix. It is the strongest citation available, and no competitor article uses it.
The practical read: TACoS is an Amazon-acknowledged concept but a seller-calculated metric. Nobody is going to hand it to you.
What TACoS number has Amazon ever actually published?
One, in a case study, and it is worth knowing exactly what it refers to before borrowing it.
In an Amazon-published case study involving Bumble Bee Foods, the stated objective was to “maintain total advertising cost of sales (TACOS) below 10%,” and the reported result was that “TACoS came in at 5.51%, well below the 10% goal.”
That is the only TACoS benchmark from Amazon I could find. It is useful, and it has limits you should respect. It is an established grocery brand with existing demand, not a launch. It is one account, in one period, run with a specific tool. Treat it as evidence that sub 10% is achievable for a mature consumer brand, not as a target for your new product.
Everything else you read about TACoS benchmarks, including the figures in the next section, comes from operator experience rather than published data. I would rather tell you that than dress a working framework up as research.
What does good TACoS look like at each stage?
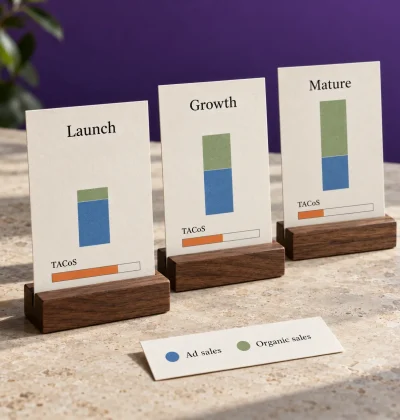
Here is the framework we use. It is AKSpire’s operating view from managing accounts, not Amazon guidance, and no primary source backs the numbers. Use it as a starting shape and replace it with your own data as you accumulate it.
| Stage | What is happening | Working TACoS range | What it means if you are outside it |
| Launch, weeks 1 to 8 | Buying position, no organic base | 30% and above is normal | Below 15% this early usually means you are underspending and the launch will stall |
| Ramp, months 3 to 6 | Organic beginning to contribute | 20% to 30%, trending down | Flat here means ads are substituting for organic, not building it |
| Established | Organic carries a real share | 10% to 20% | Rising at flat sales is the earliest warning sign of a listing or competitive problem |
| Mature | Brand demand exists | Below 10% | Amazon’s one published case study sits at 5.51% for a mature grocery brand |
| Harvest or exit | Clearing stock, no future to protect | Whatever clears inventory | TACoS stops being a management metric here. Cash recovery is the goal |
The direction matters more than the level. A product at 24% TACoS falling steadily month over month is healthier than one at 14% that has been flat for a year, because the first is building an organic base and the second has stopped.
One number to pair with it. A TACoS target means nothing without your contribution margin, because ad spend comes out of the same margin as everything else. Amazon makes the equivalent point about ACoS plainly: your ACoS needs to be lower than your profit margin to maintain a profit. The same logic applies to TACoS against your blended margin. Setting margin-based target setting before you set a TACoS goal is the step most accounts skip.
Why does TACoS break, and how do you avoid it?
Almost always in the denominator. Four ways.
Revenue that Amazon did not generate. If total revenue in your spreadsheet includes wholesale, retail or Shopify sales, your TACoS is artificially low and tells you nothing about Amazon. Use Amazon total sales only, from the Business Reports, not company revenue.
Parent and child rollups. Calculate TACoS at parent level when ad spend sits on one child and organic sales sit on another, and the number will look fine while a variation quietly fails. Calculate at the level you make decisions at.
Vendor and seller mixed together. If you run both 1P and 3P on the same ASIN, ad spend and revenue sit in different systems. Pick one scope and stay in it.
Promotion periods. Prime Day and Black Friday inflate the denominator and crush TACoS for a week. Amazon notes the related effect on ACoS directly, writing that during the holiday season “traffic increases and more brands are active, which can drive ACOS higher.” Compare event weeks to the same event last year, never to the week before.
Pulling TACoS reliably means joining ad spend from the advertising reports to total sales from the Business Reports, at a consistent level, every month, with the same rules. That is a reporting discipline problem more than an analytics one, and it is why most sellers calculate it twice and then stop. Having one source of truth for the join matters more than the sophistication of the calculation.
Quick Verdict: how to use TACoS
- Track the trend, not the level. A falling TACoS at rising sales is the signal. A single month’s figure in isolation tells you almost nothing.
- Set the target against your margin first. A TACoS goal chosen before you know your contribution margin is a number nobody can bank.
- Calculate it at the level you make decisions. Parent-level TACoS hides failing children, which is where most of the damage happens.
- Never compare an event week to a normal week. Deal periods move the denominator hard in both directions.
Does advertising actually lift organic sales?
This is the assumption TACoS rests on, so it deserves an honest answer rather than a confident one.
The logic is straightforward. Ads generate sales, sales generate velocity and reviews, and both feed organic ranking. Almost everyone in the category treats this as settled.
The first-party evidence is thinner than the confidence. Amazon has published one study examining how advertising relates to organic rankings, and its scope is narrow: it covers video ads specifically, in Saudi Arabia and the United Arab Emirates, over 2024. Amazon’s own language is hedged throughout, saying video advertising “may contribute to improved organic rankings” and “may help accelerate organic ranking growth for new products.”
So the honest position is this. There is first-party evidence pointing in the expected direction, it is limited to one ad format in two markets, and Amazon words it cautiously. That is still better evidence than the category usually offers, and it is not the same as a proven universal mechanism.
What this means practically: TACoS is the right management metric because it captures total business performance regardless of attribution, not because the ads-to-organic link has been proven at scale. Those are different reasons and the second one is weaker than people assume.
What do you do when TACoS moves the wrong way?
Diagnose the direction before you touch spend.
TACoS rising, total sales rising. Usually fine. You are buying growth. Check that contribution margin after ads is still positive, and decide whether the growth rate justifies the cost.
TACoS rising, total sales flat. The warning case. Ads are replacing organic sales rather than adding to them. Look at organic session share and conversion rate before you look at bids, because this pattern is usually a listing or competitive problem rather than a bidding one.
TACoS falling, total sales falling. The dangerous one, because it looks like efficiency. You have cut spend on terms that were supporting organic position, and the organic decay shows up weeks later. This is the single most common way a well-meaning optimization destroys an account.
TACoS falling, total sales rising. The goal. Organic is taking share from paid. Hold the structure and resist the urge to cut spend further, because that is how you end up in case three.
One practical rule for all four. Move one variable at a time and give it a full month. TACoS is a slow metric by construction, because the organic half of the denominator responds on a lag of several weeks. Change bids, budgets and negatives in the same fortnight and you will have a number that moved without knowing which change moved it. The sellers who get the most out of this metric are not the ones who check it most often. They are the ones who change one thing, wait, and write down what happened.
What this comes down to
TACoS is the right metric and it is not a metric Amazon gives you. It is absent from Amazon’s ACoS guide, its ROAS guide and its advertising FAQ, and there is no column for it in the console. You build it, with your own rules, which means the rules matter more than the number.
There is no published benchmark worth borrowing beyond one Amazon case study at 5.51% for a mature grocery brand. A launching product and a mature one cannot share a target, and any article giving you a single band for both has not thought about it.
Set the target against your margin, track the trend rather than the level, calculate it at the level you make decisions, and treat a falling TACoS alongside falling sales as a problem rather than a win. That last rule alone will save more accounts than any bidding strategy.
Frequently Asked Questions
What is TACoS on Amazon?
Total advertising cost of sale is ad spend divided by total revenue, paid and organic combined. ACoS divides the same spend by ad-attributed revenue only. Amazon does not report TACoS in the ad console, so you calculate it yourself by joining advertising spend to total sales from your Business Reports at a consistent level.
What is a good TACoS percentage?
There is no published benchmark. The only TACoS figure Amazon has published is a case study where an established grocery brand targeted below 10% and achieved 5.51%. A launching product will sit far higher, often above 30%, and that is normal. The trend direction matters more than any single level.
Does Amazon show TACoS in Seller Central?
No. Amazon’s ACoS guide, ROAS guide and advertising FAQ do not mention TACoS, and there is no column for it in the advertising console. You build it from two sources: ad spend from the advertising reports and total sales from Business Reports. Any TACoS number you see came from someone’s calculation.
Why is my TACoS rising while my ACoS improves?
Because they measure different things. ACoS improves when you cut ad spend, even when that spend was supporting organic rank. If organic sales then decay, total revenue falls while ad spend stays proportionally similar, so TACoS rises. This divergence is the main reason to track both rather than either alone.
Should I use TACoS or ACoS?
Both, for different jobs. ACoS judges campaign efficiency and is the right metric for deciding bids on a specific term. TACoS judges whether advertising is building a business and is the right metric for deciding budget. Managing to ACoS alone is how accounts shrink while every report looks better.
Resources and further reading
The following sources were used to inform and validate this article.
- Amazon Ads: Advertising cost of sales. Amazon’s ACoS formula, its statement that there is no definitive good ACoS, and the rule that ACoS must be below profit margin. The page does not mention TACoS.
- Amazon Ads: Return on ad spend. Amazon’s ROAS definition, and a second confirmation that TACoS is absent from Amazon’s metric documentation.
- Amazon Ads: Common holiday advertising myths. The only Amazon guide that names TACoS in Amazon’s own voice, including the statement that ACoS measures only ad-attributed efficiency.
- Amazon Ads case study: Xnurta and Bumble Bee Foods. The only Amazon-published TACoS benchmark, a sub 10% goal with a 5.51% result.
- Amazon Ads: Video ads and organic ranking impact. Amazon’s first-party study on advertising and organic rankings, limited to video ads in Saudi Arabia and the UAE during 2024.